As data, and big data in particular, becomes more prevalent, so too do tools for storing, analysing, and transforming it. And thanks to the constantly evolving data landscape of the last few years, there has been a rush of new big data platforms that offer all-in-one solutions. The most recent of these platforms is Microsoft Fabric.
If we take a look at how Microsoft is promoting Fabric, then it is in a position to bring your data into the age of AI. It offers tight integration between products, which allows for an accelerated development cycle for product teams in the global IT industry. It is a game changer that is fundamental to the way that organisations are going to work with data in the future.
WHAT
You might be wondering, what is Microsoft Fabric? Microsoft Fabric is a new unified analytics solution for organizations, covering everything from data movement to data science, real-time analytics, and business intelligence.
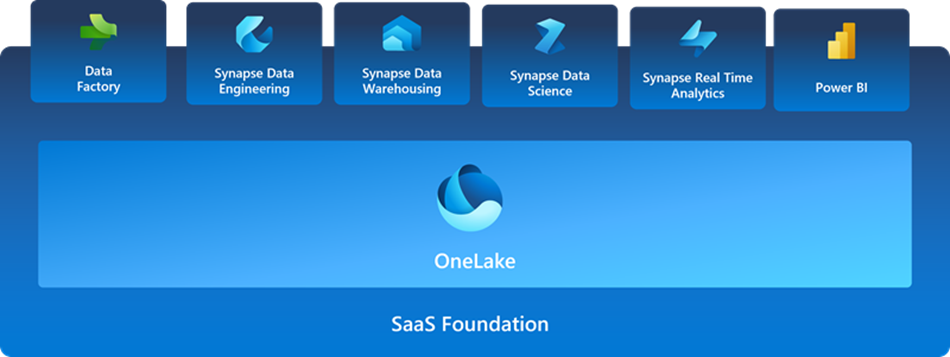
For that, Fabric combines new and existing components from Power BI, Azure Synapse, Azure Data Factory and more into one integrated environment. These components are presented in a variety of customised user experiences on a SaaS foundation. They are called: Data Engineering, Data Factory, Data Science, Data Warehouse, Real-Time Analytics, and Power BI.
Because we have all these services in one place, we don’t have to piece together different services from a number ofdifferent vendors. It allows us to leverage a highly integrated, end-to-end product that is designed to simplify our analytics needs.
Why would you want to use Fabric rather than another platform? Here are some of the benefits that Microsoft says you can expect.
- An extensive range of deeply integrated analytics in the industry.
- Shared experiences across experiences that are familiar and easy to learn.
- Developers can easily access and reuse all assets.
- A unified data lake that allows you to retain the data where it is while using your preferred analytics tools.
- Centralized administration and governance across all experiences.
With Fabric, all data is stored in OneLake, a single, unified, logical data lake for your entire organisation. When you create a Fabric capacity, you automatically get a OneLake, which is designed to be the single place for all your analytics data.
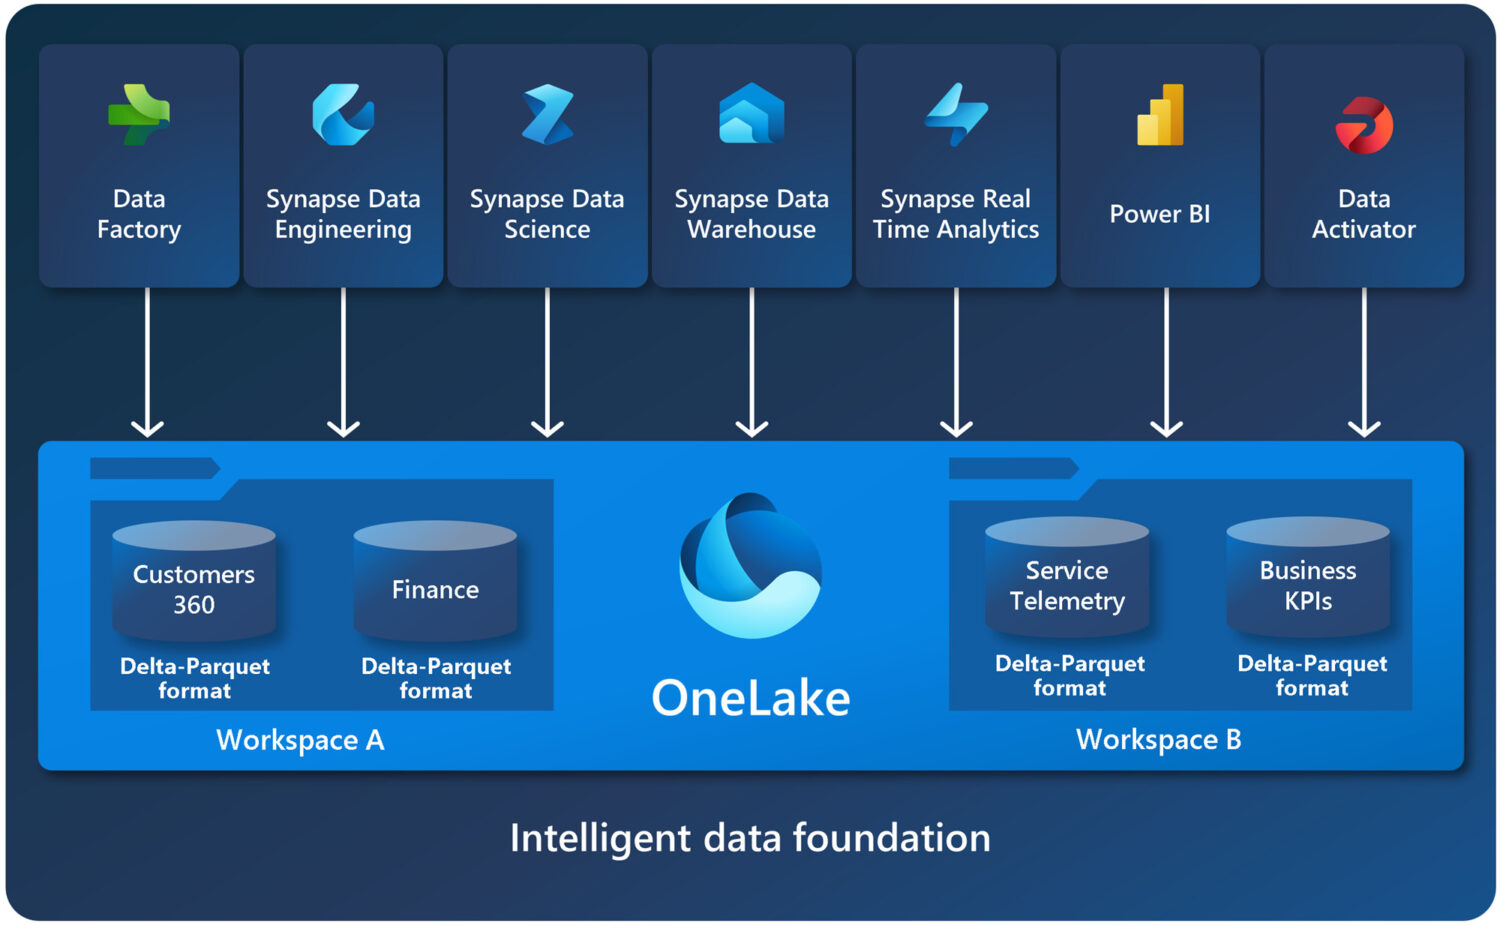
The fact that OneLake is a data lake for your entire organisation means you don’t have to copy your data for multiple analytics engines. And the fact that it is built on Azure Data Lake Storage (ADLS) Gen 2 means that it can support any type of file, structured or unstructured, and has the same API and SDK accessibility as ADLS Gen2.
USE CASE
It’s in our nature not to trust anything until we’ve seen it for ourselves, so we’ve built a use case to put the theory to the test. To do this, we have a customer, let’s call him Bill, who has a staging area for all his sales data in ADLS Gen2 and he wants to create a Power BI report using this data. To help him with this task, we are going to implement the Medallion architecture to transform his data into a usable data model based on a star schema.
The data lifecycle will look something like the figure below.
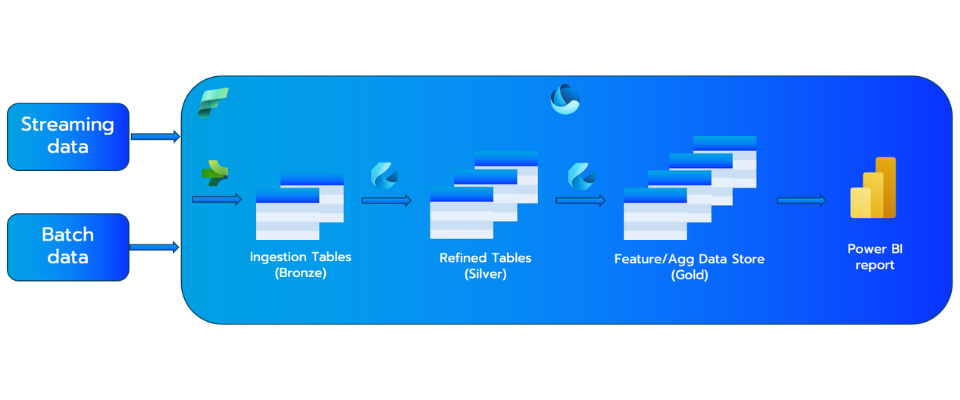
Now that we have an idea of what our data lifecycle will be like, we can start the implementation. The first thing we need to do is create a new workspace. This is to make sure that our resources do not get mixed up with any of the other projects in our organisation. In this workspace, we will then be able to create a Lakehouse (from the data engineering experience) or a warehouse (from the data warehouse experience) to store our data.
Microsoft Fabric's Data Engineering
Microsoft Fabric’s Data Engineering experience enables users to design, build, and maintain infrastructures and systems that enable organisations to collect, store, process, and analyse data. It provides various data engineering capabilities, such as creating data Lakehouses, pipelines and notebooks, or submitting a batch/streaming job to a Spark cluster.
The data warehousing experience in Microsoft Fabric introduces a lake-centric data warehouse that is built on top of an enterprise-class distributed processing engine. Data warehousing workloads can take advantage of the rich capabilities of the SQL engine over an open data format.
After we have our data storage set up, we can start to develop our notebooks. This can be done in a git repository connected to Fabric or in the workspace. This time we will choose to do everything in our workspace. In the meantime, is there a decision to be made about how we want our notebooks to look? This could be one large notebook for each layer or separate notebooks for each table created. The second way of working will ensure that we can easily find the right code if we have to make any changes.
The next step in our data lifecycle is to create a pipeline. (This comes from the Data Factory experience but is also available in Data Engineering). We already have a visual representation of our use case that has been created from the very beginning. Furthermore, we can use this to create our pipeline from the ingestion of the ADLS Gen2 data to the creation of the gold layer of data.
Microsoft Fabric's Data Factory
The Data Factory experience in Microsoft Fabric enables users to ingest, prepare and transform data from a wide range of data sources. It brings fast copy (data movement) capabilities to both dataflows and data pipelines. These are also the two primary high-level features of Data Factory.
Dataflows let you transform data more easily and flexibly than any other tool, with more than 300 transformations in the Dataflow Designer.
Data pipelines give you a rich set of out-of-the-box data orchestration capabilities to put together flexible data workflows.
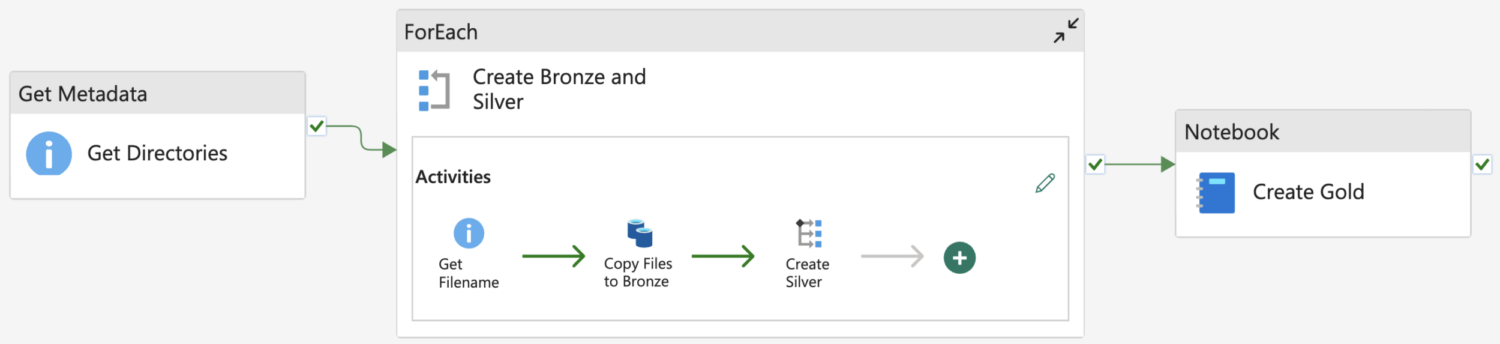
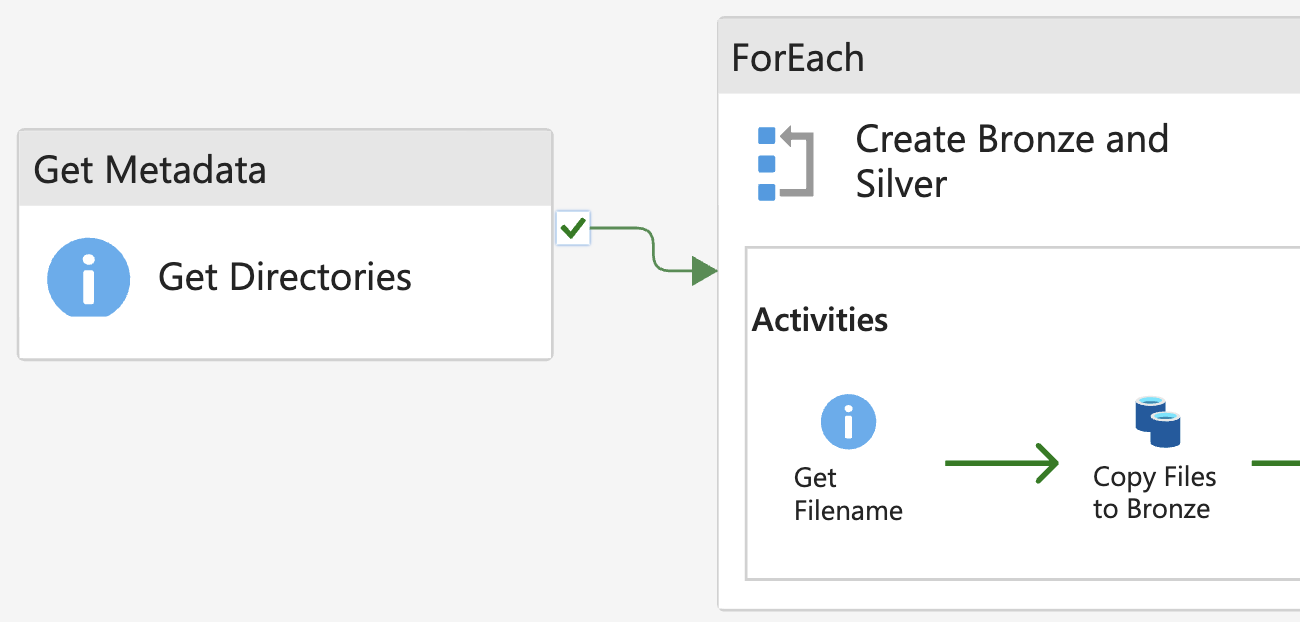
The first thing that we need to do in the pipeline is to get the data needed. If we look at ADLS Gen2, we can see that there are different directories for each part of the data, in these directories are the data files we need to get. In order todo this from within our pipeline, we need to get the metadata from the storage container, so our pipeline also knows what directories there are. Herefor we will use a ‘ForEach’ on the directories and have a look at the files available. This time there is only one file, which makes it a lot easier for us. We can just pass this filepath to our copy activity and give it the destination to put the data in, which is a directory called ‘Bronze’ in the Lakehouse.
As we move forward in the Medallion architecture is the silver layer. This is a cleaned-up version of the bronze layer. This layer will be created in notebooks like we previously said. And as luck will have it does this mean that we can go further in our ‘ForEach’ and add a ‘Switch’. This ‘Switch’ will look for the directory where the copy just happened and run the appropriate notebook for the silver layer.
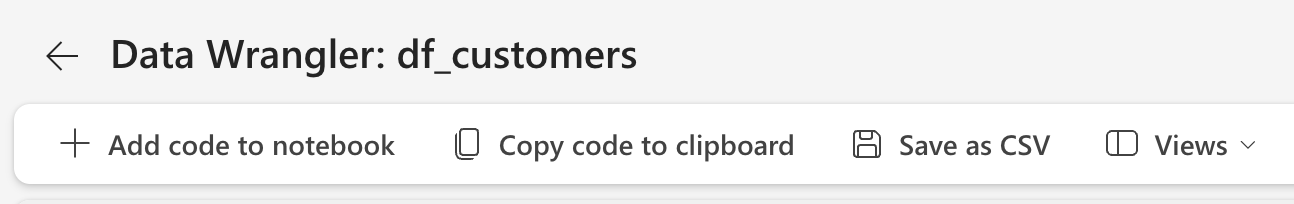
To come back to the creation of the notebooks for the silver layers. This can be done in one of two ways in Fabric. We can code everything in the notebooks ourselves, from retrieving the data to putting it into a Spark dataframe and then doing transformations to improve the quality of the data, or we can use the Data Wrangler feature available in Fabric notebooks.
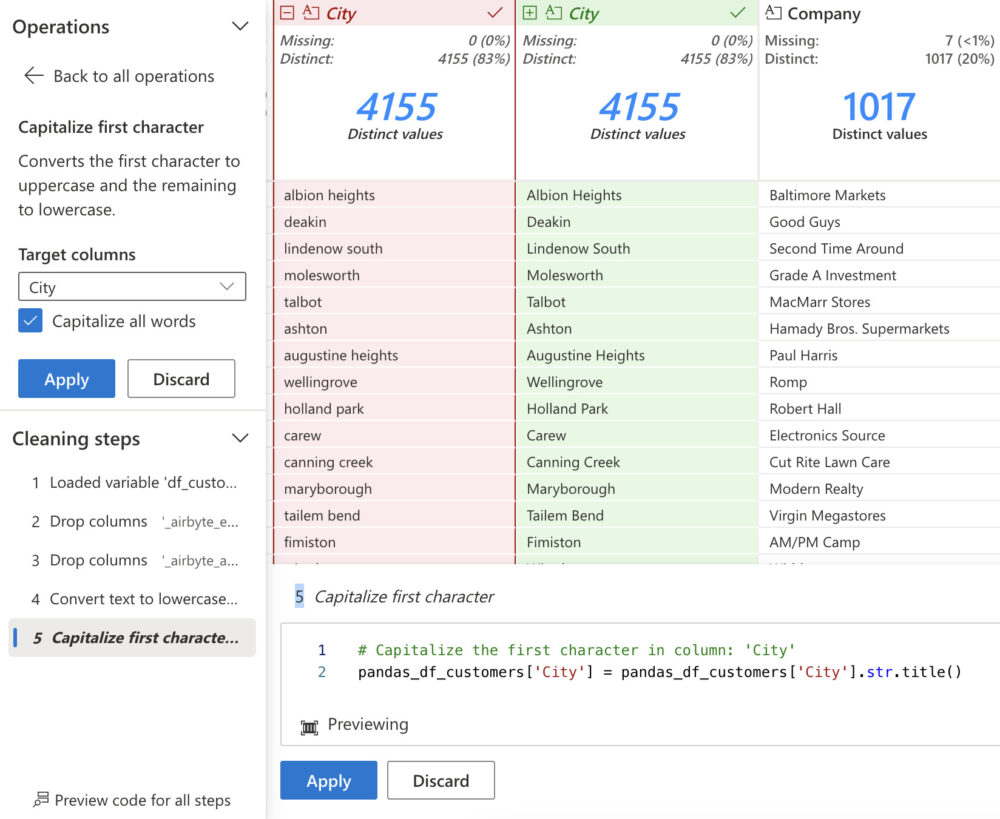
If we choose the Data Wrangler feature, all we need to do is read our data into a dataframe. After that, Data Wrangler will be able to have a look at that data and use it. The use interface gives us direct visual feedback on the transformations we perform. And when we are satisfied with the cleanness of the data, we have the option to save the generated code. We can choose to copy this code to the clipboard, export it as a function to our notebook, or save the transformed data frame as a csv file.
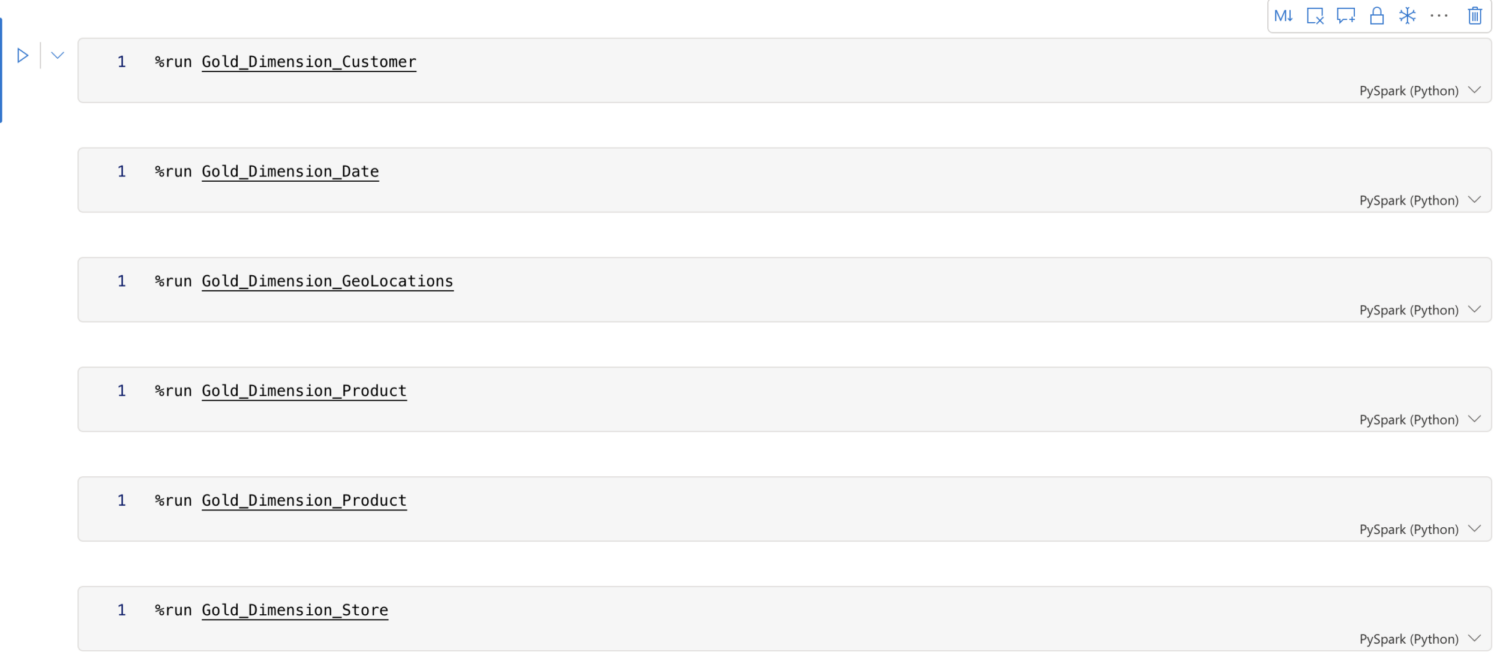
For the final stage of our pipeline, we are going to create the gold layer with the curated data at the business level. To keep our pipeline clean we will use one notebook to run the gold layer notebooks, which can be done with the %run command in a notebook cell.
At the end of our pipeline both the silver layer and the gold layer are in the same Lakehouse. This is not a bad thing by any means, but in order to keep everything organised, we are going to split them up. The easiest way to do this is to save our gold layer Delta tables in another Lakehouse or Warehouse. This time we will choose another Lakehouse.

Finally, we have our star schema in the gold layer, with this we can go on to create the Power BI report that our customer Bill had requested. Thanks to Power BI’s integration with Fabric, there is high data availability, which speeds up our report creation. Not only did our use case meet Bill’s needs but it also highlighted our expertise in structured data management and strategic technological application in data analytics
Microsoft Fabric's Power BI
Power BI is natively integrated with Microsoft Fabric. This native integration has given rise to a unique way of accessing data from the Lakehouse, DirectLake. DirectLake offers high performance query and report capabilities. Another type of connectivity in Fabric is called Semantic Link. With Semantic Link, you can use semantic models from Power BI in the data science experience to perform tasks such as in-depth statistical analysis and predictive modelling using machine learning techniques.
CONCLUSION
Now that our use case is complete and we have tested some of the capabilities of Fabric, is it everything Microsoft promised? We would say yes.
In our experience, Fabric is a one-stop shop that provides everything you need to work with your data. This is thanks to the integration between Microsoft’s old and new products. Not only that, but new features such as DirectLake and Semantic Link have accelerated the development process. All of this, together with the clear user interface, makes it a definite recommendation for both beginners and experienced developers and their organisations.