Like in any area of technological development and design, agile has made its way to data warehouse design. Over the past few decades, the agile mindset has gained momentum, becoming the standard in software and technology development. The well-known Agile Manifesto has twelve points that can be summarized as:
- Individuals and interactions over processes and tools
- Working software over comprehensive documentation
- Customer collaboration over contract negotiation
- Responding to change over following a plan
The BEAM✲ method, developed by Lawrence Corr and Jim Stagnitto and published in their book Agile Data Warehouse Design: Collaborative Dimensional Modeling, from Whiteboard to Star Schema (Amazon, eBook), is an agile approach to dimensional modelling. It is a structured method where Business Intelligence requirements analysis and dimensional modelling techniques are brought together.
Dimensional modelling, as pioneered by Ralph Kimball, is a design approach optimized for data retrieval and analysis. It structures data into facts (measurable, quantitative data) and dimensions (contextual descriptors), forming a star schema. The key features of dimensional modelling include:
- User-Centric Design: Models are intuitive and aligned with business processes, making it easier for analysts and end-users to query the data.
- Performance Optimization: Simplified schemas improve query performance, enabling efficient data retrieval for Business Intelligence (BI) and analytics.
- Scalability and Flexibility: Dimensional models adapt to growing datasets and changing business requirements.
Kimball emphasized understanding business processes and involving stakeholders early in the design to ensure the model reflects real-world needs. BEAM✲ stands for Business Events Analysis & Modelling, with the ✲ symbol representing the ultimate delivery of star schemas. BEAM✲ is a methodology that aligns well with the foundational philosophy of Kimball. Through modelstorming (data modelling + brainstorming) with BI stakeholders, business events are analysed and translated into star schemas representing user-centric design. It concentrates on business events rather than reporting requirements, resulting in a model that can be scaled as requirements grow. The technique leans well to use agile’s collaborative and iterative ethos. Using BEAM✲, designers can adopt ‘Just Enough Design Upfront’ (JEDUF) in the initial iterations and ‘Just-In-Time’ (JIT) detailed design within each iteration, accelerating development while keeping the data warehouse aligned with business priorities.
The BEAM✲ methodology is a useful addition to the skillset of any member of an agile data warehouse/business intelligence team, extending beyond business analysts to developers, architects, and other stakeholders. It is a powerful addition to other diagrams and documentation tools for communicating dimensional design ideas to stakeholders.
This article is the first in a series, introducing Business Event Analysis through the BEAM✲ table template as detailed in the book. From the information gathered in the Business Event Analysis stage, dimension and fact table types can be easily identified. A second article will cover how these dimensions and fact tables are constructed.
Asking the right questions
The methodology introduced by Lawrence Corr aims to create understandable models of the business events by asking stakeholders to tell data stories. Business events are the individual actions performed during business processes and the measurable atomic details of the process. Data stories are narratives from the business to discover data requirements like user stories concentrate on functional requirements.
At its core, BEAM✲ focuses on using six dimensional types and a measure type—collectively known as the “7Ws”—to identify and elaborate on business events. The 7Ws used by BEAM✲ are: Who, What, When, Where, How, How Many, and Why. A similar conceptual technique is used in investigative journalism to ensure full story reporting coverage.
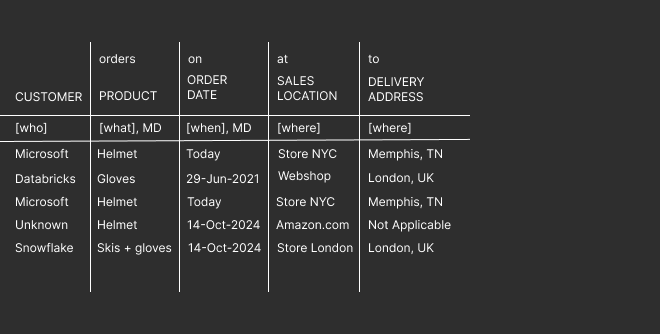
For a specified business process area, the BEAM✲ idea is to identify event stories by asking a ’who does what’ question and then expressing the answer as a simple story. For example, “a customer buys products.” A series of these ’who does what’ stories are captured and then the remainder of the 7Ws such as the ‘when’ and ‘where’ are asked to drive out their interesting details. The results are documented in an example data tables or BEAM✲ table (see figure below), one of the tools employed in the BEAM✲ technique.
BEAM✲ uses the tabular notation with example data stories to define business events. The tabular notation is a recognisable spreadsheet-like format that is very familiar to the business stakeholders while still being easily translatable into star schemes. These example data stories are designed to capture edge cases, handle missing data, and account for evolving real-world events during the analysis phase.
BEAM✲ tables are typically built up on whiteboards from stakeholders’ responses to the 7 W’s looking more like tabular reports than data models. The practical techniques, tools and artefacts of the BEAM✲ methodology allow the business users to become actively engaged in the process and to contribute in an intelligent and structured way.
Use Case - Frosty Adventures
Frosty Adventures, a globally recognized B2B company specializing in winter gear and equipment, approached DataSense with a critical challenge: their complete lack of understanding of their own operations. Despite their success in international markets, the company struggled to gain a clear understanding of their internal workflows, inefficiencies, and areas for improvement. Data is fragmented across various sources, making it nearly impossible to piece together a clear picture of their workflows or requirements. To address this, Frosty Adventures sought a scalable and centralized data warehouse solution to not only consolidate their data, but also uncover critical insights, enabling them to define and optimize their processes while enhancing overall efficiency and supporting future growth.
It was instantly clear to us that we must dedicate enough time to the data discovery phase with Frosty Adventures before we could start building their data warehouse. We need to agree upon a data model that will serve as the blueprint for their warehouse, ensuring that the warehouse accurately reflects the business processes and supports efficient data retrieval. Dimensional modelling is a key approach for this, as it organizes data into easily understood structures, such as facts and dimensions. This simplifies complex queries, improves performance, and enables intuitive analysis, making it the foundation of a successful, user-friendly data warehouse. Luckily our consultants of DataSense just enhanced their skills with a new technique, BEAM✲, an agile approach to dimensional modelling. As this approach requires close collaboration between the BEAM✲ modeler(s) and the business stakeholders, we set-up a one-day workshop in a room with only some chairs, a white-board and black markers. The goal is to dive deep into the event modelling process through an iterative, hands-on approach.
According to the BEAM✲ technique, modelling an event is an iterative three-step process: Discover, Document and Describe, also called the 3Ds. The discover phase uses techniques like interviews and brainstorming to uncover business processes that are interesting for reporting and analytics. Teams collaborate to explore the organization’s goals, processes and business needs. The document phase is used to translate the processes (one by one) into a structured narrative. Multiple tools can be used for this phase, here the BEAM✲ example data table is used. The final step, the describe phase, involves formalizing details by going over the 7Ws. Key aspects such as dimensions, facts, and their relationships are clarified.
Discover an event
For the first phase, the discover phase, a brainstorming session is set up with a mix of employees that are identified as subject matter experts. The goal is to find a number of processes that needs to be modelled in the data warehouse. At the start of the brainstorming, a BEAM✲ modeler asks the simple question “Who does what?”. It’s a very open question, but will always point to an event or an action. In a room full of stakeholders across different departments, we expect a variety of answers. No stakeholder has to be afraid, we will capture all their information. Some might provide brief answers, while others could offer extensive details. In the end, we’re looking for three key elements: a subject, a verb and an object e.g. “customer orders a product”. This serves as our starting point. In later phases, we’ll refine and add more details.
At first, Frosty Adventures’ stakeholders were hesitant, but once we captured the first event on the whiteboard, the responses quickly flowed. The whiteboard soon filled with events like: “an employee sells a product”, “a supplier delivers a product”, “a customer orders a product”, …

For simplicity, we’ll continue working with the event: “a customer orders a product”. We will tackle the other events in later iterations.
Document the event
Focusing on a single event, we proceed to document it in the form of a BEAM✲ example data table. Typically, this table is drawn on the whiteboard so that all stakeholders can see and contribute. With the increase of remote work in the recent years, collaborative online tools like Figma increased in popularity. This is a workable substitute for the whiteboard session if there are participants that cannot make it to the session in person.
Lawrence Corr introduces some guidelines and standardizations for documenting. The BEAM✲ table follows that standard notation: subject & object are capitalized and the verb is placed above the object in lowercase letters. The capitalized column headers eventually become facts or dimensions, while the lowercase words add context to the event story, making it easier to understand.

Describe the event
Describing the event is the phase where we enhance the BEAM✲ table by asking deeper questions based on the 7W’s.The BEAM✲ methodology provides a structured guideline, known as the BEAM✲ sequence, for asking these questions in a logical order to ensure comprehensive coverage. The graph below shows the order of the 7W’s along with the information acquired at each question.
We’ve already explored who and what in the discovery phase and defined the first subject-verb-object to document: ‘Customer orders product’. Our next question will loud as “When do customers order products?”. Ideally, the response would be something like ‘on an order date’, which is a detail that contributes to our event story and will eventually be stored in the data warehouse.

The preposition of the noun helps determine the level of time detail needed. As ‘on’ is used, it implies that the finest level to record is the date and that the time part is not needed. Our BEAM✲ table looks like this now:

The BEAM✲ table is now mature enough for collecting event stories. Event stories are example stories of the business process in scope with their interactions. Example stories clarify the meaning of each event detail with minimal documentation, avoiding abstraction by illustrating concrete scenarios. To ensure we cover all possible scenarios, we add 5-6 example rows that illustrate the following themes:
- Typical: An example that represents 90% of the cases
- Different: An example that differs from the typical case
- Repeat: An example that is as similar as possible to the typical case
- Missing: An example showing which values can be missing and which are mandatory
- Group: An example that includes groupings
Doing this, the BEAM✲ table describes most of what we need to know about the model. The concrete examples bring clarity and alignment, making it easier to design effective data models and analytics.
We can now make a few conclusions about the event based upon the BEAM✲ table:
- There’s no unique key for the event (yet), as one customer can order the same product on the same date.
- The product and order date detail are mandatory details (we note this by adding MD to the table) and cannot be missing.
- The oldest event story can be identified based on the order date, which raises the question of how far back in time we should collect data.
- A customer is always a business and a product can also be a bundle of items.

After collecting the first ‘when‘ detail, you should make sure that you covered all the possible ‘when’ details before moving on. In this case, a stakeholder from Frosty Adventures suggested an additional ‘when’ detail “Orders are a due for delivery on a delivery due date”. We add each new detail to our BEAM✲ table along with some examples.

Following the BEAM✲ sequence, the next step is to ask the “where“ question. However, since this is an agile approach with many iterations, we first loop back to the who question to determine if there are any other “who” elements connected to the event.
We then ask who questions with all the prepositions we can think of “Customers order product from/for/with who?”. One additional “who” that the stakeholders identify is the salesperson, so we update the BEAM✲ table accordingly. We left out the delivery due date detail because BEAM✲ tables tend to get very wide.

In line with the BEAM✲ sequence, we also ask for additional whats associated with the event. This is especially important if the event lacks a “what” detail so far. Once we’ve clarified the “what?” we proceed with the where question. “Customer orders product, where?” is the next question we ask to get an idea how Frosty Adventures sells their products. The BEAM✲ table is further enriched with this new information.
Next, we ask how many questions to uncover quantities associated with the event, which will later become the facts in the data warehouse and inform measures and KPIs for BI reports and dashboards. All variants (how many, how much, how long, …) are allowed e.g. “customer orders how many products?” and a likely answer would be the order quantity. We also need to track the unit of measurement for each quantity to ensure accurate data representation. We add this using the square brackets type notation.

Frosty Adventures is a global company selling their product in euros, dollars and pounds. This is highlighted in the table and after some discussion, the standard unit to report will be euro.
The next step in modeling the event is to explore the why detail. Asking “Why do customers order products?” is too broad, so we refine the question to: “Why do customers order products in these quantities, on these dates, and at these locations?”. Considering it’s Black Friday, one stakeholder mentions promotions, while another recalls a recent product launch event. This the collaboration that we had expected by bringing all stakeholders from different departments together.

Our workshop is about the end, but there’s just enough time to address the final question in the BEAM✲ sequence—the how. How refers to the actual mechanism behind the business event itself. This often includes transaction identifiers from the operational system that capture each event e.g. an order id kept by Frosty Adventures’s ERP system.

To complete our documentation of the event, we need to address the following 3 points:
Event granularity
Each event story must be uniquely identifiable. Therefore you must have enough details about the event so that each example story can be distinguished from one another. In most cases a combination of who, what, when and where will suffice, but in other cases we have to rely upon the transaction identifier (how) created by their operational system. The columns that made up the granular details are denoted by GD in the BEAM✲ table.
Naming the event
Until now, the event has only been identified by a combination of the who and what details, such as “a customer orders a product.” We need to agree upon a short descriptive name where every stakeholder is comfortable with. To make things easy, we mostly create a combination of the subject and the verb: CUSTOMER ORDERS.
Define event story type
In the BEAM✲ theory, there are three types of event stories:
- Discrete Event (DE): All details are known before the event is loaded into the data warehouse. The event is inserted once and never updated. This event will become an transaction fact table in the warehouse.
- Recurring Event (RE): Many details of this event are semi-additive and must be reported over multiple time periods. This event will be implemented as a periodic snapshot fact table in the warehouse.
- Evolving Event (EE): Details are loaded shortly after the first event and updated each time a milestone occurs until the event story is completed. This event will become an accumulating snapshot fact table.
Applying this logic to our event, we conclude that the CUSTOMER ORDERS event is an discrete event, denoted by DE.
As we have finished our first BEAM✲ table successfully, we draw a double bar on the right edge. By reading our final BEAM✲ table we can read an event story like “Microsoft orders 15 Helmets today, for delivery due to three days from now, from James Bond at the Store NYC, for delivery to Memphis, TN, for €450, on no promotion with zero discount using order O1222.”
By the end of the workshop, we successfully modeled our first event. The whiteboard is filled with details, and the BEAM✲ table reflects a complete, well-documented event story.

Conclusion
The BEAM✲ methodology is an approach to agile data warehouse design, allowing business and technical teams to create scalable, user-focused data models and document it in a readable format. Through modelstorming and data stories, BEAM✲ ensures that stakeholders actively participate in defining business events and uncovering the details necessary for robust dimensional modelling. Its structured, iterative process—centered around the “7Ws”—enables the development of intuitive and efficient data warehouses aligned with the needs of the organisation.
The Frosty Adventures case study illustrates how BEAM✲ facilitates a comprehensive understanding of business processes, guiding stakeholders to collectively build a meaningful data model. Through iterative workshops and hands-on collaboration, Frosty Adventures has the first business event modelled for a centralized data warehouse capable of supporting operational insights and future growth.
As data warehouses become increasingly integral to business intelligence, adopting agile methodologies like BEAM✲ offers teams a framework for delivering value quickly while maintaining flexibility. This series will continue to explore how dimensions and fact tables, derived from BEAM✲ tables, are constructed and optimized for analytics.